You pay nothing unless we win.
View our appearances.
Results speak for themselves.
NATIONWIDE
PERSONAL INJURY LAWYERS
Have you or a loved one been injured due to the negligence of someone else? We promise our best 100% of the time.
When an unexpected injury or death is caused by another's negligent, reckless, or careless act, it can upend your life and feel like there is nowhere to turn and that the U.S. justice system has failed you. But you have options! While support from family, friends, and the community can go a long way, it's important to remember that you have the power to take legal action.
At Thomas Law Offices, our personal injury lawyers provide quality legal counsel while treating our clients with the utmost respect. Our clients are our priority and receive emotional support and the most high quality representation possible. We fight every case—from car accident injury lawsuits to medical malpractice, product liability, and nursing home neglect cases—as aggressively as necessary to ensure our clients get the financial help they need to recover and get their lives back in order.
Thomas Law Offices first opened in 2011 when founder Tad Thomas envisioned a private practice where the needs of victims and their family members always came first. We treat every case with the personalized attention and specialized knowledge it deserves. Our firm aims to give back to the community whenever possible by volunteering to improve education and defending the right to trial by jury.
We believe that the legal profession, as a whole, needs to focus first and foremost on clients who are truly in need. If you've been injured in an accident through no fault of your own—whether it be a truck accident, an incident caused by a defective product, or any other type of personal injury accident, you need a lawyer who can serve your needs and no one else's. That's why we're here.
Every attorney and paralegal working at Thomas Law Offices is dedicated to taking on cases that result in successful, positive outcomes. By being mindful of both their clients' immediate and long-term needs, Tad Thomas and his team can make closure and full compensation a reality.
Time matters. Call now.
Your path to justice starts here.
Cases We Handle
What Our Clients Say

Why Choose TLO?
Free Case Evaluation
At Thomas Law Offices, our personal injury attorneys recognize that our potential clients are likely going through some of the most difficult times of their lives. We don't want you to have to worry about paying out of pocket for legal advice when you're just starting to learn your legal rights and options. That's why we provide free case evaluations. We'll offer our expert advice about your potential case and walk you through how we can help you.
Meet Our Founder
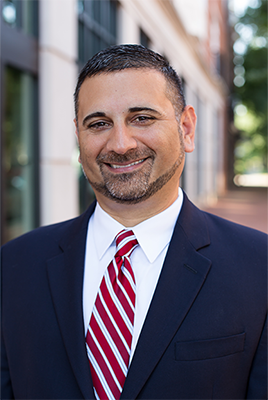
Tad Thomas
Managing Partner
Tad Thomas has dedicated his practice to representing plaintiffs in various types of civil litigation, including personal injury, business litigation, class actions, and multi-district litigation.
After graduating with his law degree in 2000 from Salmon P. Chase College of Law at Northern Kentucky University, Mr. Thomas immediately opened his own private practice and began representing injury victims.
In 2011, Thomas Law Offices was established in Louisville, Kentucky. Over the past decade, Mr. Thomas has expanded his firm and now has offices in three additional locations: Cincinnati, Ohio, Columbia, Missouri, and Chicago, Illinois. He is also a frequent lecturer on topics like trial skills and ethics and technology.
Legal & Firm News
Apr 16, 2024
Where Do Car Accidents Happen Most Often in Chicago?
As someone who lives in or has traveled through Chicago, you likely don’t need any reminding of how congested our city’s roadways are. This heavy traffic often leads to collisions, which cause motorists to suffer serious injuries and lose their lives. While you’re likely aware of where some of our city’s crash-prone roadways are if […]
Apr 10, 2024
Learn How to Protect Your Loved Ones with My Nursing Home Abuse Guide
Thomas Law Offices has over a decade of experience helping families seek justice on behalf of loved ones who have been abused, neglected, or otherwise harmed in nursing homes and long-term care facilities around the nation. Tad Thomas himself has spoken multiple times on live TV about the work our firm does and the changes […]
Apr 10, 2024
One Year Since Old National Bank Shooting, Co-Counsel Representing Survivors, Families Release Statement
LOUISVILLE, KY – Today, Thomas Law Offices, Everytown Law, and Romanucci & Blandin, who together represent survivors as well as families who lost loved ones in the mass shooting at Old National Bank in Louisville on April 10, 2023, released the following statement: “April 10th marks one year since the tragic mass shooting at the […]